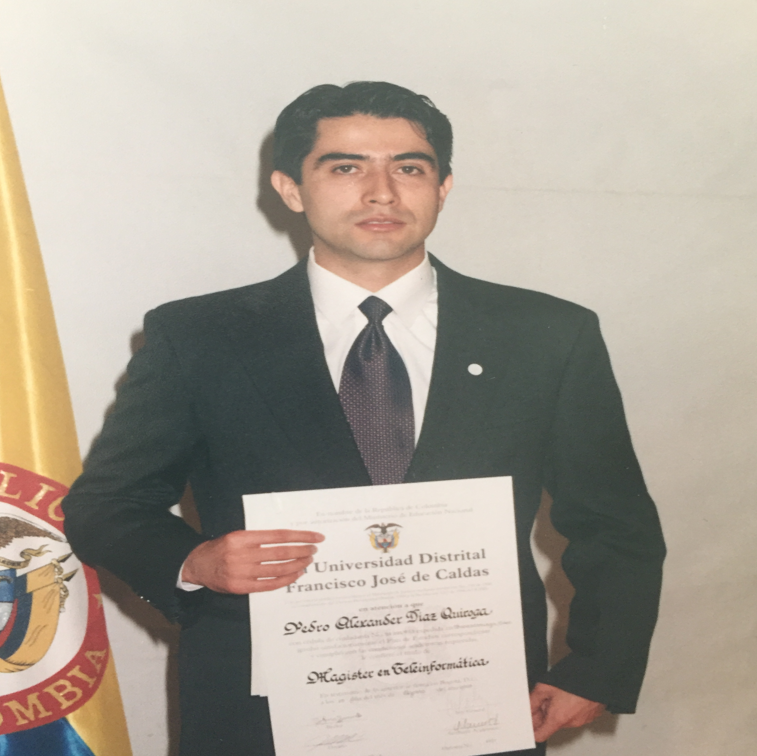
Hi! My name is Pedro Alexander Díaz Quiroga. I studied electrical engineering at Universidad de la Salle, after graduating I worked in the area of telecommunications. I always liked physics and especially electromagnetism. I studied a Master in teleinformatics in Universidad Distrital. In 2007 I get my CCIE R&S certification from Cisco Systems where I worked. Now I am very interested in data engineering so I am studing Master of Information Engineering at Universidad de los Andes in Bogotá Colombia. From August 2016 I am getting expertise in programming languages such as Python and javascript in different projects of telecomunications and data engineering.
In this website you will find out more about me, the projects I have worked on and the things I’m interested in. Here is a condensed version of my trajectory in pdf format:
In the following blog posts you can find more information about the projects I have worked on:

|

|

|

|

Begin working at Impsat (after Global Crossing, level3, century link)

Master Science in teleinformatics

Get CCIE (Cisco Certified Internetwork Expert

Beging working at Desca (Grupo Amper)

Begin working at Cisco Systems

Begin Studying Master of Information Engineering

"A tree implemented using D3. Structually this is a binary tree and each branch is generated algorithmically. Some randomness is incorporated making it look more like a real tree.
This piece blurs the distinction between generative art and data visualisation. Arguably this isn't a data visualisation because no external data is used. However, the code does generate data for each branch (start point, angle, length and parent) and binds this data to SVG line elements using D3.
Be sure to click regenerate to see how well the awesome D3 handles the transition! Another nice feature is that when hovering over a branch the route back to the root is highlighted."
Built by Peter Cook using D3. Find out data visualisation workshops.
The tree above is a clear example of data visualization. Visualization in security is another example of utility of power of vis
To explode the power of Vis, interaction is higly desirable so security experts can play with data according to their feelings
Insighs are the last goal, combining the power of computers and security experts...
Feel free to send me an email!